
What is Revenue Architecture?
Revenue architecture is the discipline of designing the commercial model that determines how a B2B SaaS company generates, captures, and grows revenue. It covers the structural decisions that sit above day-to-day execution: pricing strategy, unit economics, revenue model design, and the financial logic that connects them.
What is the difference between Revenue Architecture and RevOps?
Unlike RevOps, which optimises how the existing model runs, revenue architecture asks whether the model itself is correct. It matters most between £1M and £10M ARR, when growth has outpaced the original commercial design and the cracks show up as compressed NRR, extending CAC payback, or investor pushback at the next raise.
Why do we need Revenue Architecture as a separate function?
Revenue architecture fills the ownership gap in a SaaS company's commercial model. The decisions around pricing, packaging, unit economics, and revenue model design have no natural owner. Ask this question to expose the gaps in your company: who owns the decision about whether your pricing model is the right one for how you deliver value? Almost always, the answer is the founder or the heads of departments. And pricing remains a consensus-based decision and not a repeatable, predictable model. Sales sells what's there. Finance reports on what happened. Product builds the roadmap. RevOps runs the systems. Each function touches the commercial model. None of them designed it.
This is why structural problems take so long to surface. A pricing tier that suppresses expansion looks fine on the dashboard until NRR starts compressing eighteen months later. An ICP that has quietly drifted toward harder-to-serve customers looks fine in the pipeline until CAC payback extends beyond 24 months. The model drifts because no one is monitoring it. By the time the symptoms appear, the cause is buried under a year of execution.
Revenue architecture exists to close this gap, making the commercial model an object of design rather than an accumulation of decisions.
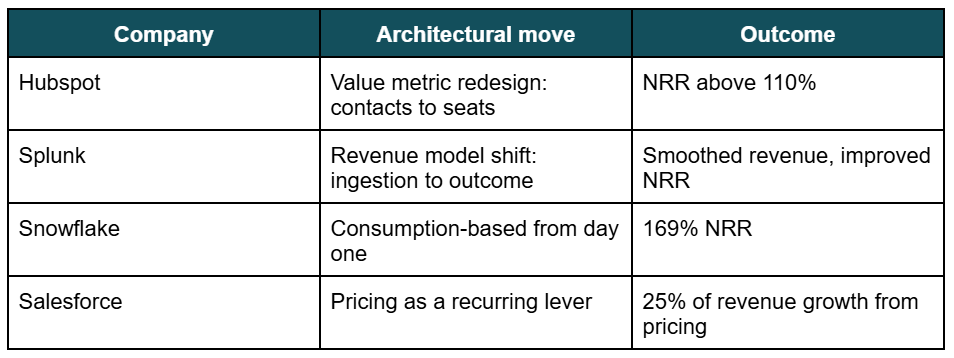
Revenue architecture looks different depending on what the company needs to fix. HubSpot's contact-based pricing punished customers as their databases grew, with costs rising even when the value delivered did not. The redesign tied price to seats, lifting NRR above 110%.
Splunk is priced on data ingestion volume, but as the product expanded into security and observability, customers were paying for inputs while the value sat in the outputs. The shift to outcome-based pricing realigned what customers paid with what they received.
Snowflake never had to redesign. They architected consumption-based pricing from day one, which let revenue scale automatically with customer value and produced 169% NRR, among the highest in the industry.
Salesforce treated pricing as a recurring strategic lever rather than a one-off decision. Between 2022 and 2025, they systematically raised top-tier pricing from $250 to $500 per seat per month, with price increases accounting for 25% of total revenue growth during that period.
Four companies, four different architectural moves, all pointing to the same conclusion.
When can Revenue Architecture no longer be ignored?
Revenue architecture becomes urgent at predictable inflection points. Moments where the original commercial model can no longer carry the company forward. Five triggers show up most often.
The first is the run-up to a Series A or B raise, usually 12 to 18 months out. Investor questions about unit economics, NRR, or pricing power start to be answered with intuition rather than numbers, and term sheets get withdrawn or repriced at the eleventh hour.
The second is the 6 to 18 month window after a funding round closes. ARR is climbing, but gross margin is flat, CAC payback is extending past 24 months, and the burn multiple is creeping up. The company is spending the capital it raised before fixing the model that capital is meant to scale.
The third is pricing that has not materially changed in over a year while everything around it has. NRR compresses toward 100%, customers downgrade quietly, expansion flattens, or a competitor reprices. The model starts leaking revenue from customers the company already has, and acquisition spend cannot outrun retention math indefinitely.
The fourth is new market entry. A company expands from the UK into the EU, or from SMB into mid-market, and applies the existing pricing structure to a market it was never designed for. Win rates fall, sales cycles extend, and the company cannot tell whether it has a GTM problem or a model problem.
The fifth is the quietest and the most common. The company has reached £1M+ ARR with a pricing structure inherited from the founder's first instinct three years ago. No one in the business can articulate why the model is structured the way it is, because no one ever designed it.
These triggers rarely arrive alone. By the time one is visible, two more are usually forming underneath it. The discipline of revenue architecture is to read them early, and to redesign before costs compound.
What does revenue architecture deliver?
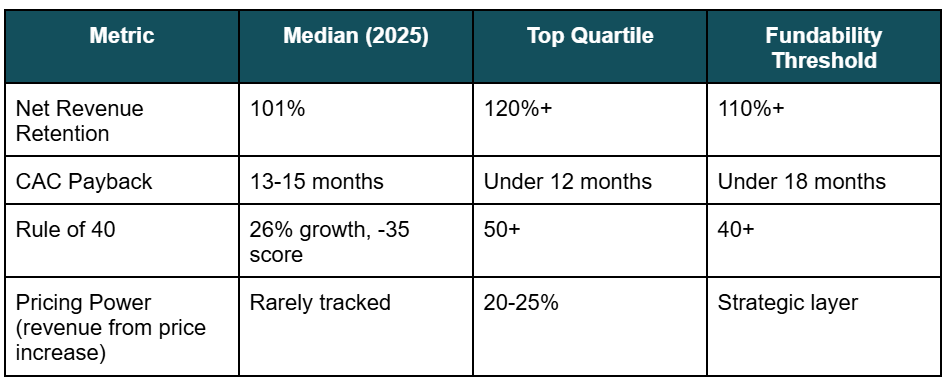
Revenue architecture delivers what investors price into the term sheet. The metrics that determine valuation, capital efficiency, and the cost of the next raise. Four outcomes matter most.
The first is Net Revenue Retention. Median NRR for B2B SaaS in 2025 sat at 101%, while top-quartile public companies maintained above 120%. The slightest change in NRR can have a substantial effect on NRR. For example, A 10-point lift in NRR can translate to a 20 to 30% increase in valuation. Revenue architecture moves this number by redesigning the value metric and expansion mechanics. The same work that took HubSpot from contact-based pricing to NRR above 110%.
The second is CAC payback compression. The Median CAC in B2B SaaS was roughly 13 to 15 months, and new customer acquisition costs rose 14% in 2025, which extends payback periods even when nothing else changes. Revenue architecture compresses payback by tightening ICP, repricing for value, and fixing unit economics at the segment level rather than at the blended level, which hides where the money is actually being lost.
The third is the Rule of 40 progression. The formula here is Growth rate + profit margin, the composite metric investors now use to assess durability. Investors usually use 40% as the threshold separating fundable companies from the rest. Revenue architecture builds the financial scenario logic that lets a founder deliberately model trade-offs between growth and burn, rather than discovering them in a board meeting.
The fourth is pricing power. Every 1% improvement in pricing translates to 11 to 15% in operating profit, according to McKinsey. Salesforce drove 25% of its revenue growth from 2022 to 2025 through pricing alone. Revenue architecture turns pricing into a recurring strategic lever rather than a one-off decision under pressure.
These four outcomes compound. NRR expansion improves Rule of 40. Pricing power compresses CAC payback. The work is structural, but the returns show up everywhere: on the dashboard, in the boardroom, and on the term sheet.
The companies that get this right are not the ones with the best sales team or the most efficient marketing engine. They are the ones whose commercial model was designed deliberately, where pricing, packaging, unit economics, and revenue logic were treated as structural decisions rather than tactical ones.
Revenue architecture is the work of making that design explicit. It will not show up in a single dashboard, but it shows up everywhere a founder eventually has to defend the business: in board meetings, in fundraising conversations, and in the quiet moment before the next decision compounds against the last one.
Sources:
HubSpot pricing evolution and NRR outcomes — Monetizely, SaaS Pricing Case Studies: How These 5 Companies Transformed Revenue (2025). Available at: getmonetizely.com
Splunk shift from ingestion to outcome-based pricing — Monetizely, SaaS Pricing Case Studies: How These 5 Companies Transformed Revenue (2025).
Snowflake 169% NRR — Monetizely, Net Revenue Retention (NRR) and Pricing: Strategies to Boost Expansion Revenue (2025), citing Snowflake investor disclosures.
Salesforce pricing as growth lever, 25% of revenue growth from pricing 2022–2025 — SaaSFactor, The 2025 SaaS Pricing Playbook (2025), citing Salesforce investor disclosures.
Median NRR 101% for B2B SaaS in 2025 — Kyle Poyar, 2025 SaaS Benchmarks Report, Growth Unhinged (November 2025), based on a survey of 800+ B2B SaaS companies.
Top-quartile NRR above 120% — Bessemer Venture Partners, State of the Cloud (2023, updated 2025). Cross-referenced with KeyBanc Capital Markets SaaS Survey (2024).
10-point NRR lift = 20–30% valuation uplift — m3ter, Net Revenue Retention and SaaS Valuations: 2026 (February 2026).
New customer acquisition costs rose 14% in 2025 — Kyle Poyar, 2025 SaaS Benchmarks Report, Growth Unhinged (November 2025).
Rule of 40 as fundability threshold — Bessemer Venture Partners' efficiency frameworks, ongoing publications.
Every 1% improvement in pricing = 11–15% operating profit lift — McKinsey & Company SaaS pricing research, as cited in Monetizely (2025).
